What Chinese Asset Management Now Competes On
The pools that make up Chinese asset management are still growing, and almost everything else about them has moved. Pricing, the licence base, the time horizon of the money and the vehicles it travels in have all changed within a few years.
The pools at mid-2026
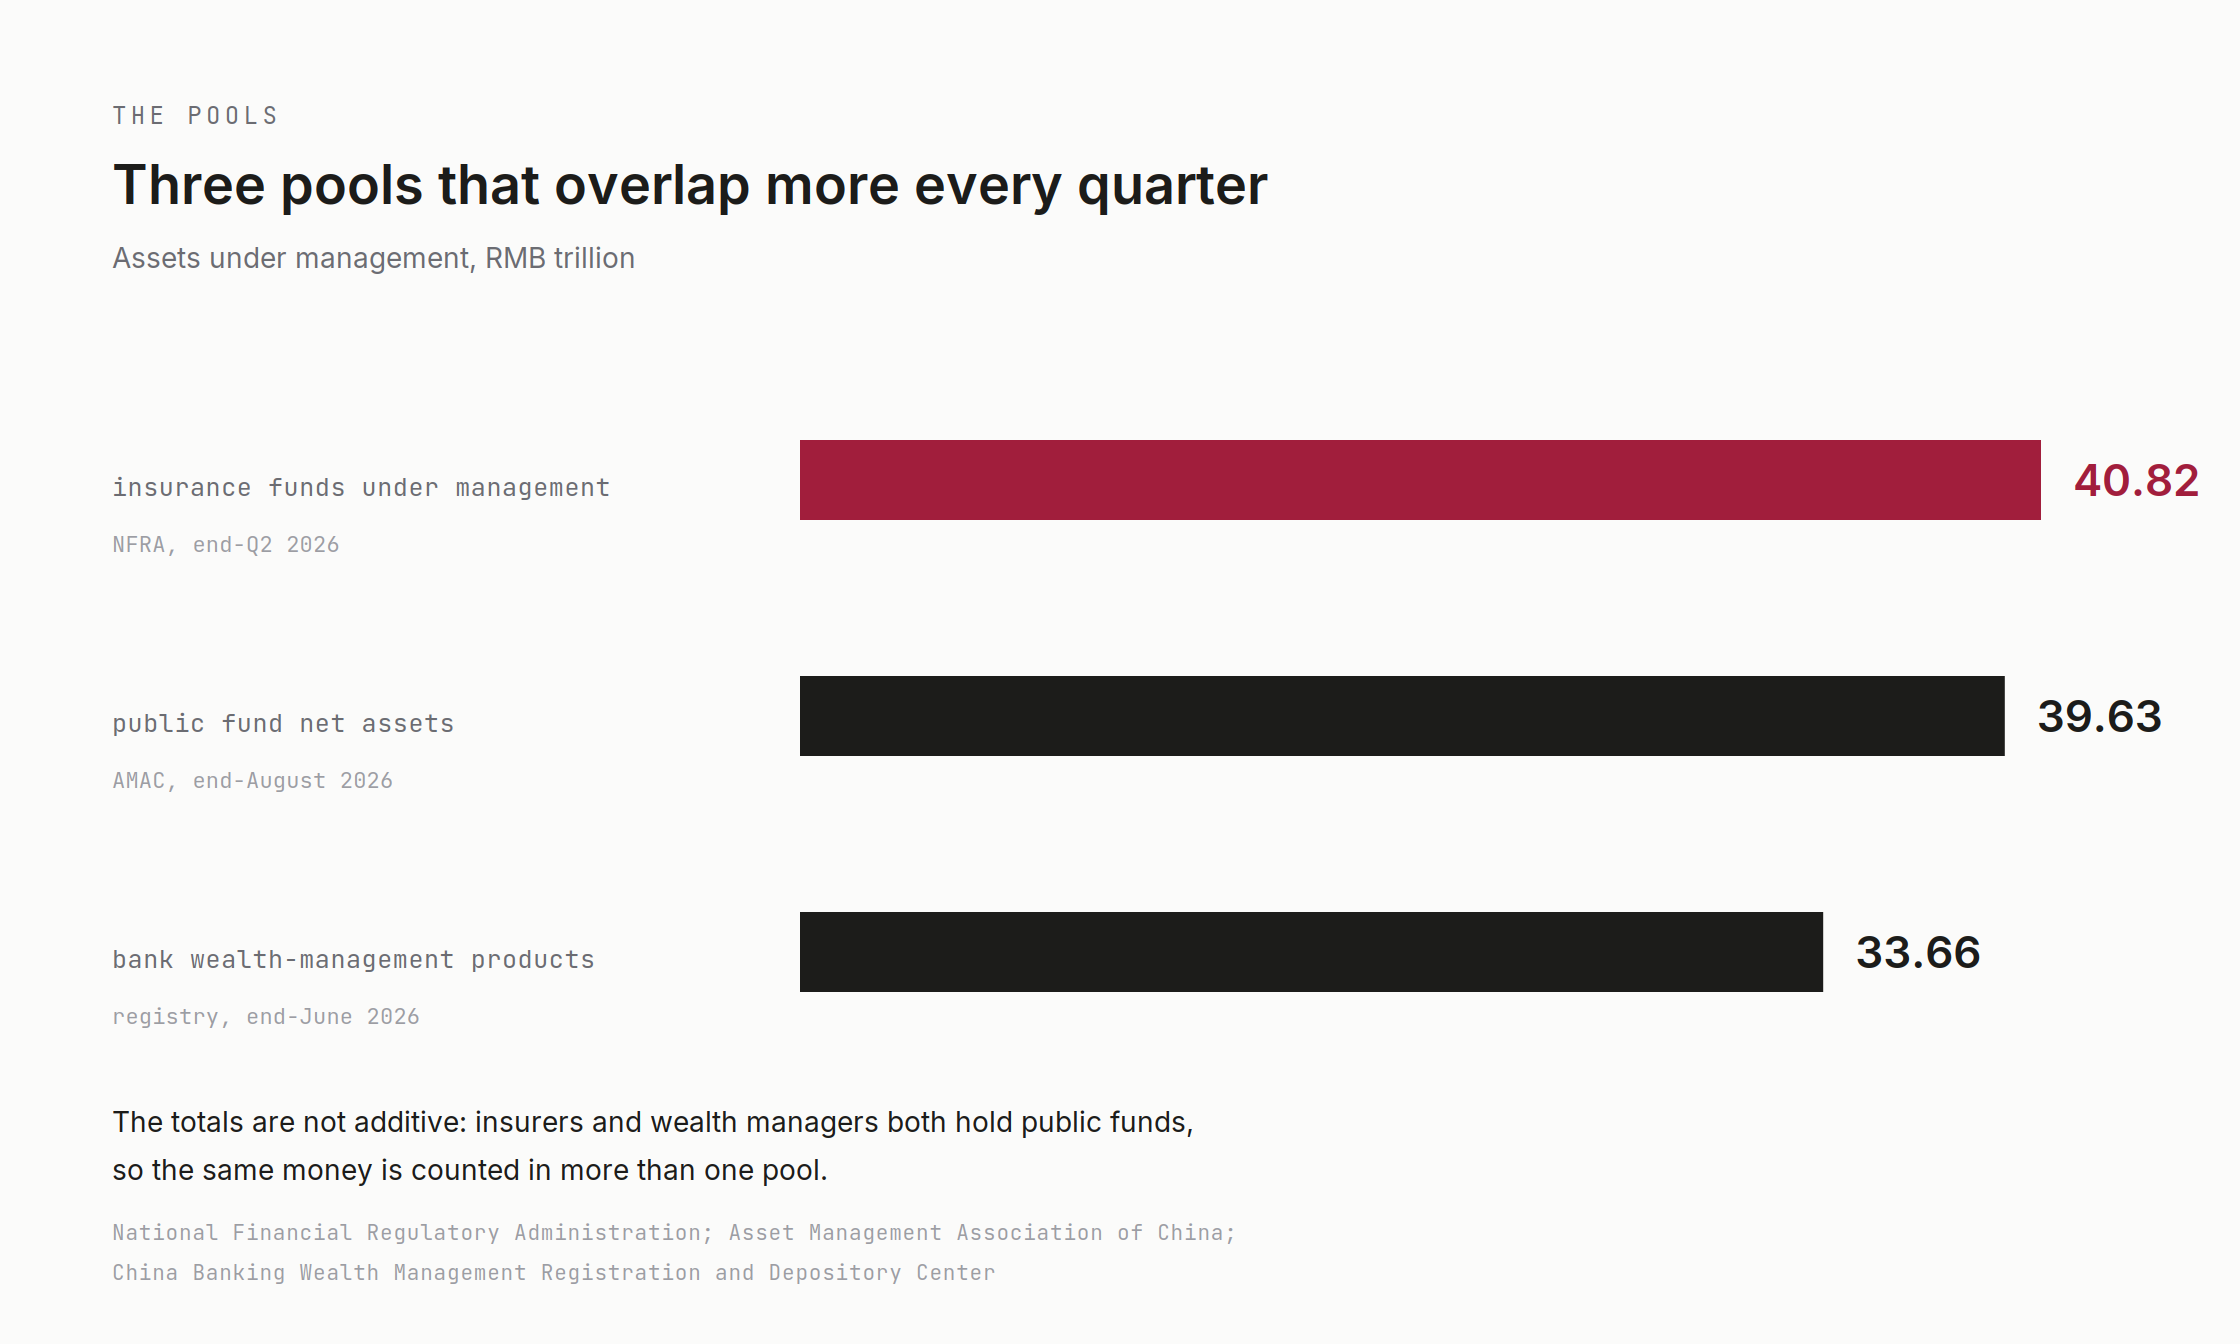
Three of the largest pools reached new marks within a few months of each other. Insurance funds under management passed RMB 40 trillion for the first time, reaching RMB 40.82 trillion at the end of the second quarter, 12.67% higher than a year earlier. Public fund net assets stood at RMB 39.63 trillion at the end of August across 14,585 funds. Bank wealth-management products held RMB 33.66 trillion at mid-year. The fund industry association put the combined assets of fund houses, securities and futures managers and private managers at RMB 88.37 trillion at the end of the second quarter. These totals overlap by design, because one pool increasingly invests through another, and that overlap is where most of the change sits.
Net value pricing finished its work
The 2018 rules that ended expected-return products completed their passage through the system by around 2025, with a small stock of legacy bank products still due to wind down. What that leaves is visible in the numbers rather than in the regulation. Bank wealth products returned an average annualised 2.05% in the first half, producing RMB 305.2 billion for 151 million investors. Fixed income accounted for RMB 32.48 trillion of the RMB 33.66 trillion total, or 96.49%. Mixed products held RMB 1.07 trillion and equity products RMB 90 billion. A pool this large, yielding close to 2% and carrying its market risk openly, leaves little room for a layered fee structure.
The licence base narrows
Growth at the top of the industry sits alongside contraction in the number of firms doing the work. Wealth management subsidiaries held RMB 31.18 trillion at mid-year, 92.63% of that market and 13.46% more than a year earlier, while products run on banks' own books fell 22.26% to RMB 2.48 trillion. The number of banks with live products of their own dropped to 153, forty-one fewer than a year before. The trust sector shows the same direction in staffing: the industry association reported headcount down to 16,600 in its most recent social responsibility report. Fewer firms are running more money, which is the ordinary consequence of rising fixed costs.
Longer money, and more of it in equity
Insurance capital is the clearest case of long-horizon money changing behaviour once evaluation periods lengthen. Equity and fund holdings together reached RMB 6.39 trillion at the end of the second quarter, 16.23% of insurance funds under management and the highest share on record, after an increase of RMB 690.7 billion in the first half. Direct equity holdings alone came to RMB 4.1 trillion, or 10.41%. The equity position has risen for eight consecutive quarters. Bonds held steady at 50.52% and bank deposits fell to 7.7% from 8.08% a quarter earlier. The 2025 plan from six agencies to lengthen assessment horizons is visible in this series.
Indexation reaches credit
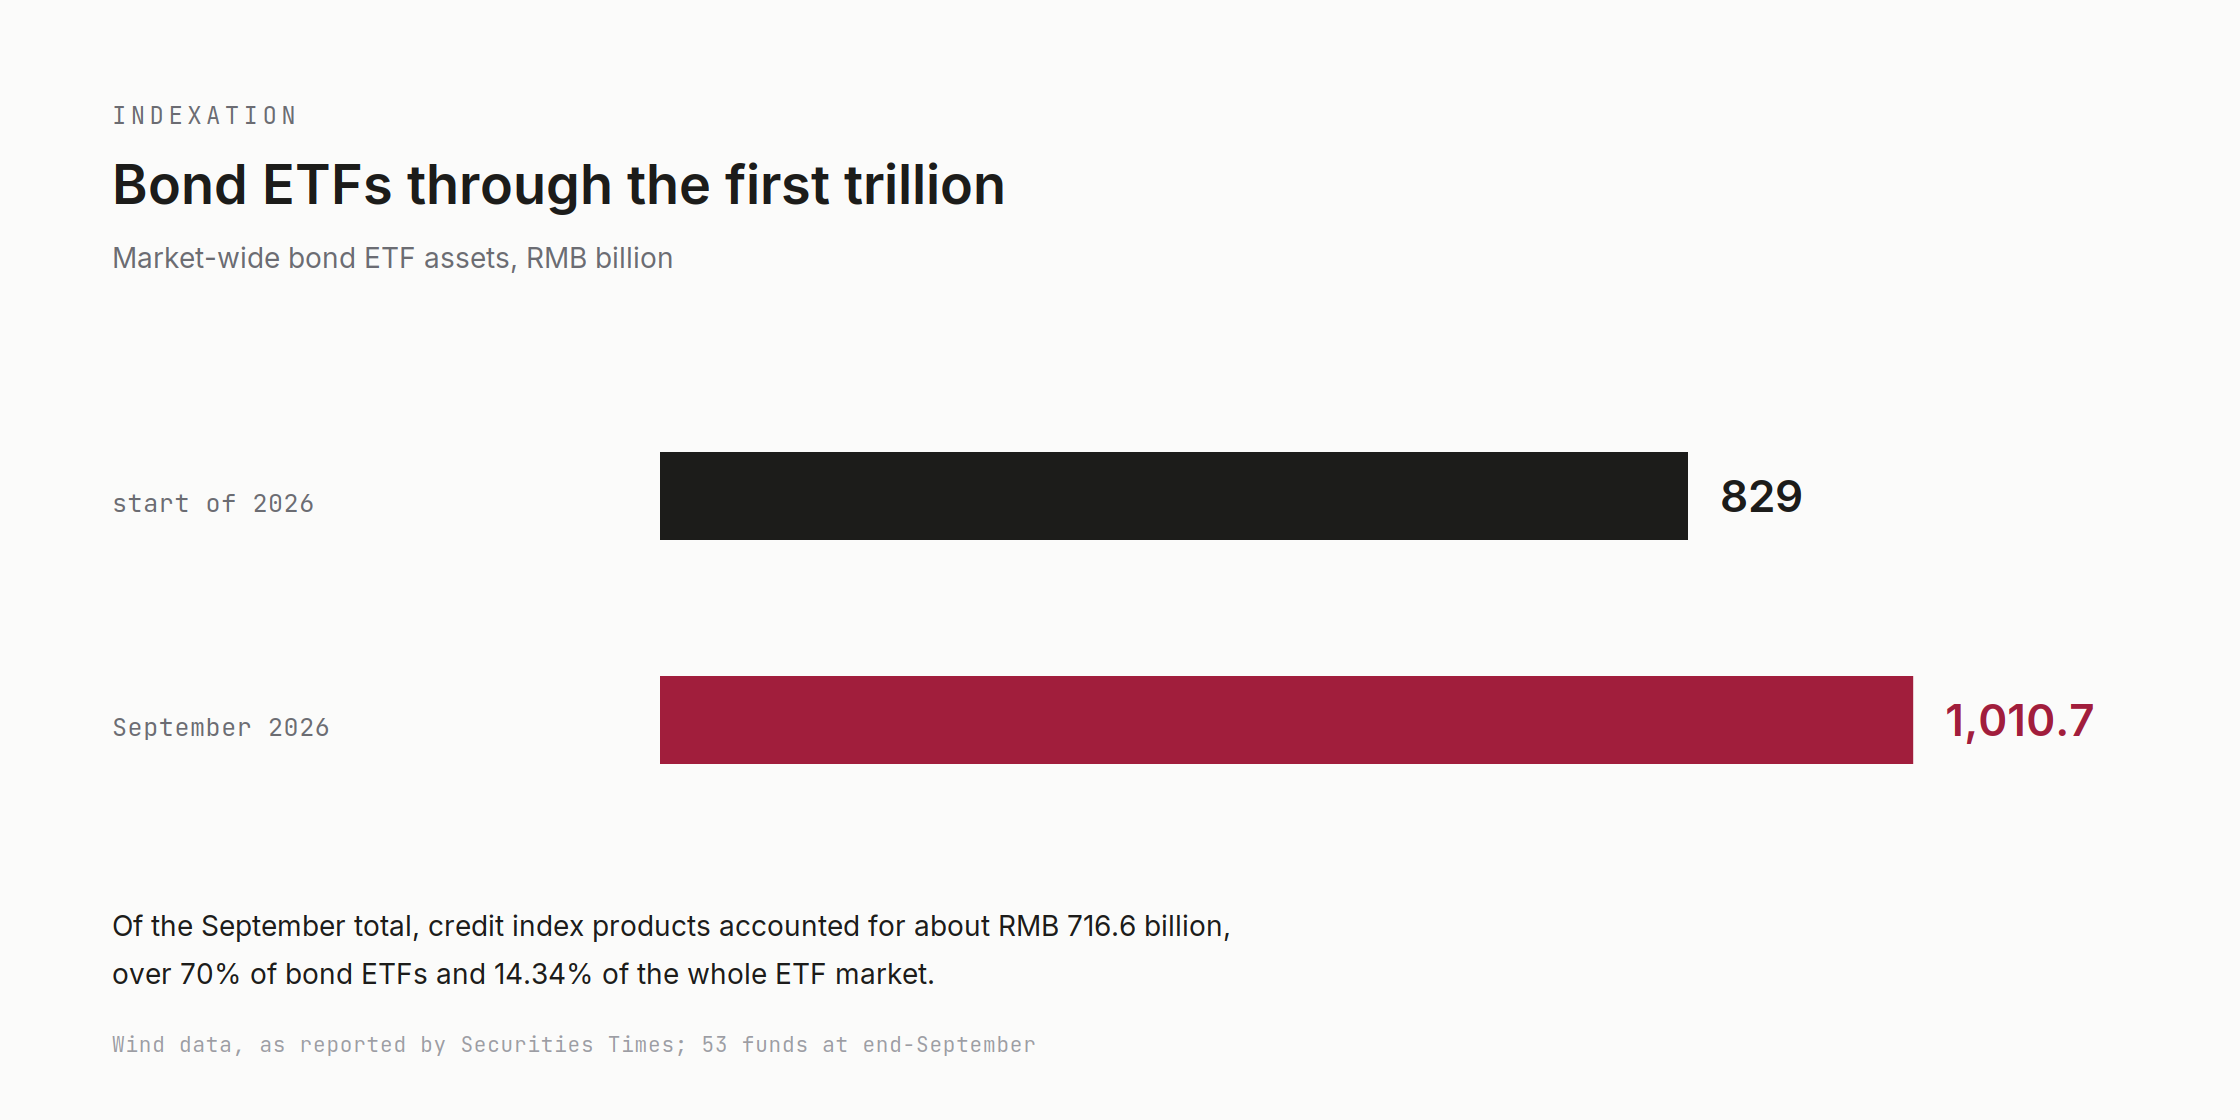
Indexation in China is usually discussed as an equity development. The fastest growth has been elsewhere. Bond exchange-traded funds passed RMB 1 trillion for the first time in September, rising from RMB 829 billion at the start of the year across 53 funds, a gain of about 22%. Credit index products accounted for roughly RMB 716.6 billion of that, more than 70% of bond ETFs and 14.34% of the entire ETF market. Total ETF assets stood at RMB 4.92 trillion across 62 managers at the end of September. The index vehicle has arrived in the asset class that holds almost all of the country's wealth-management money.
The wealth pool starts outsourcing
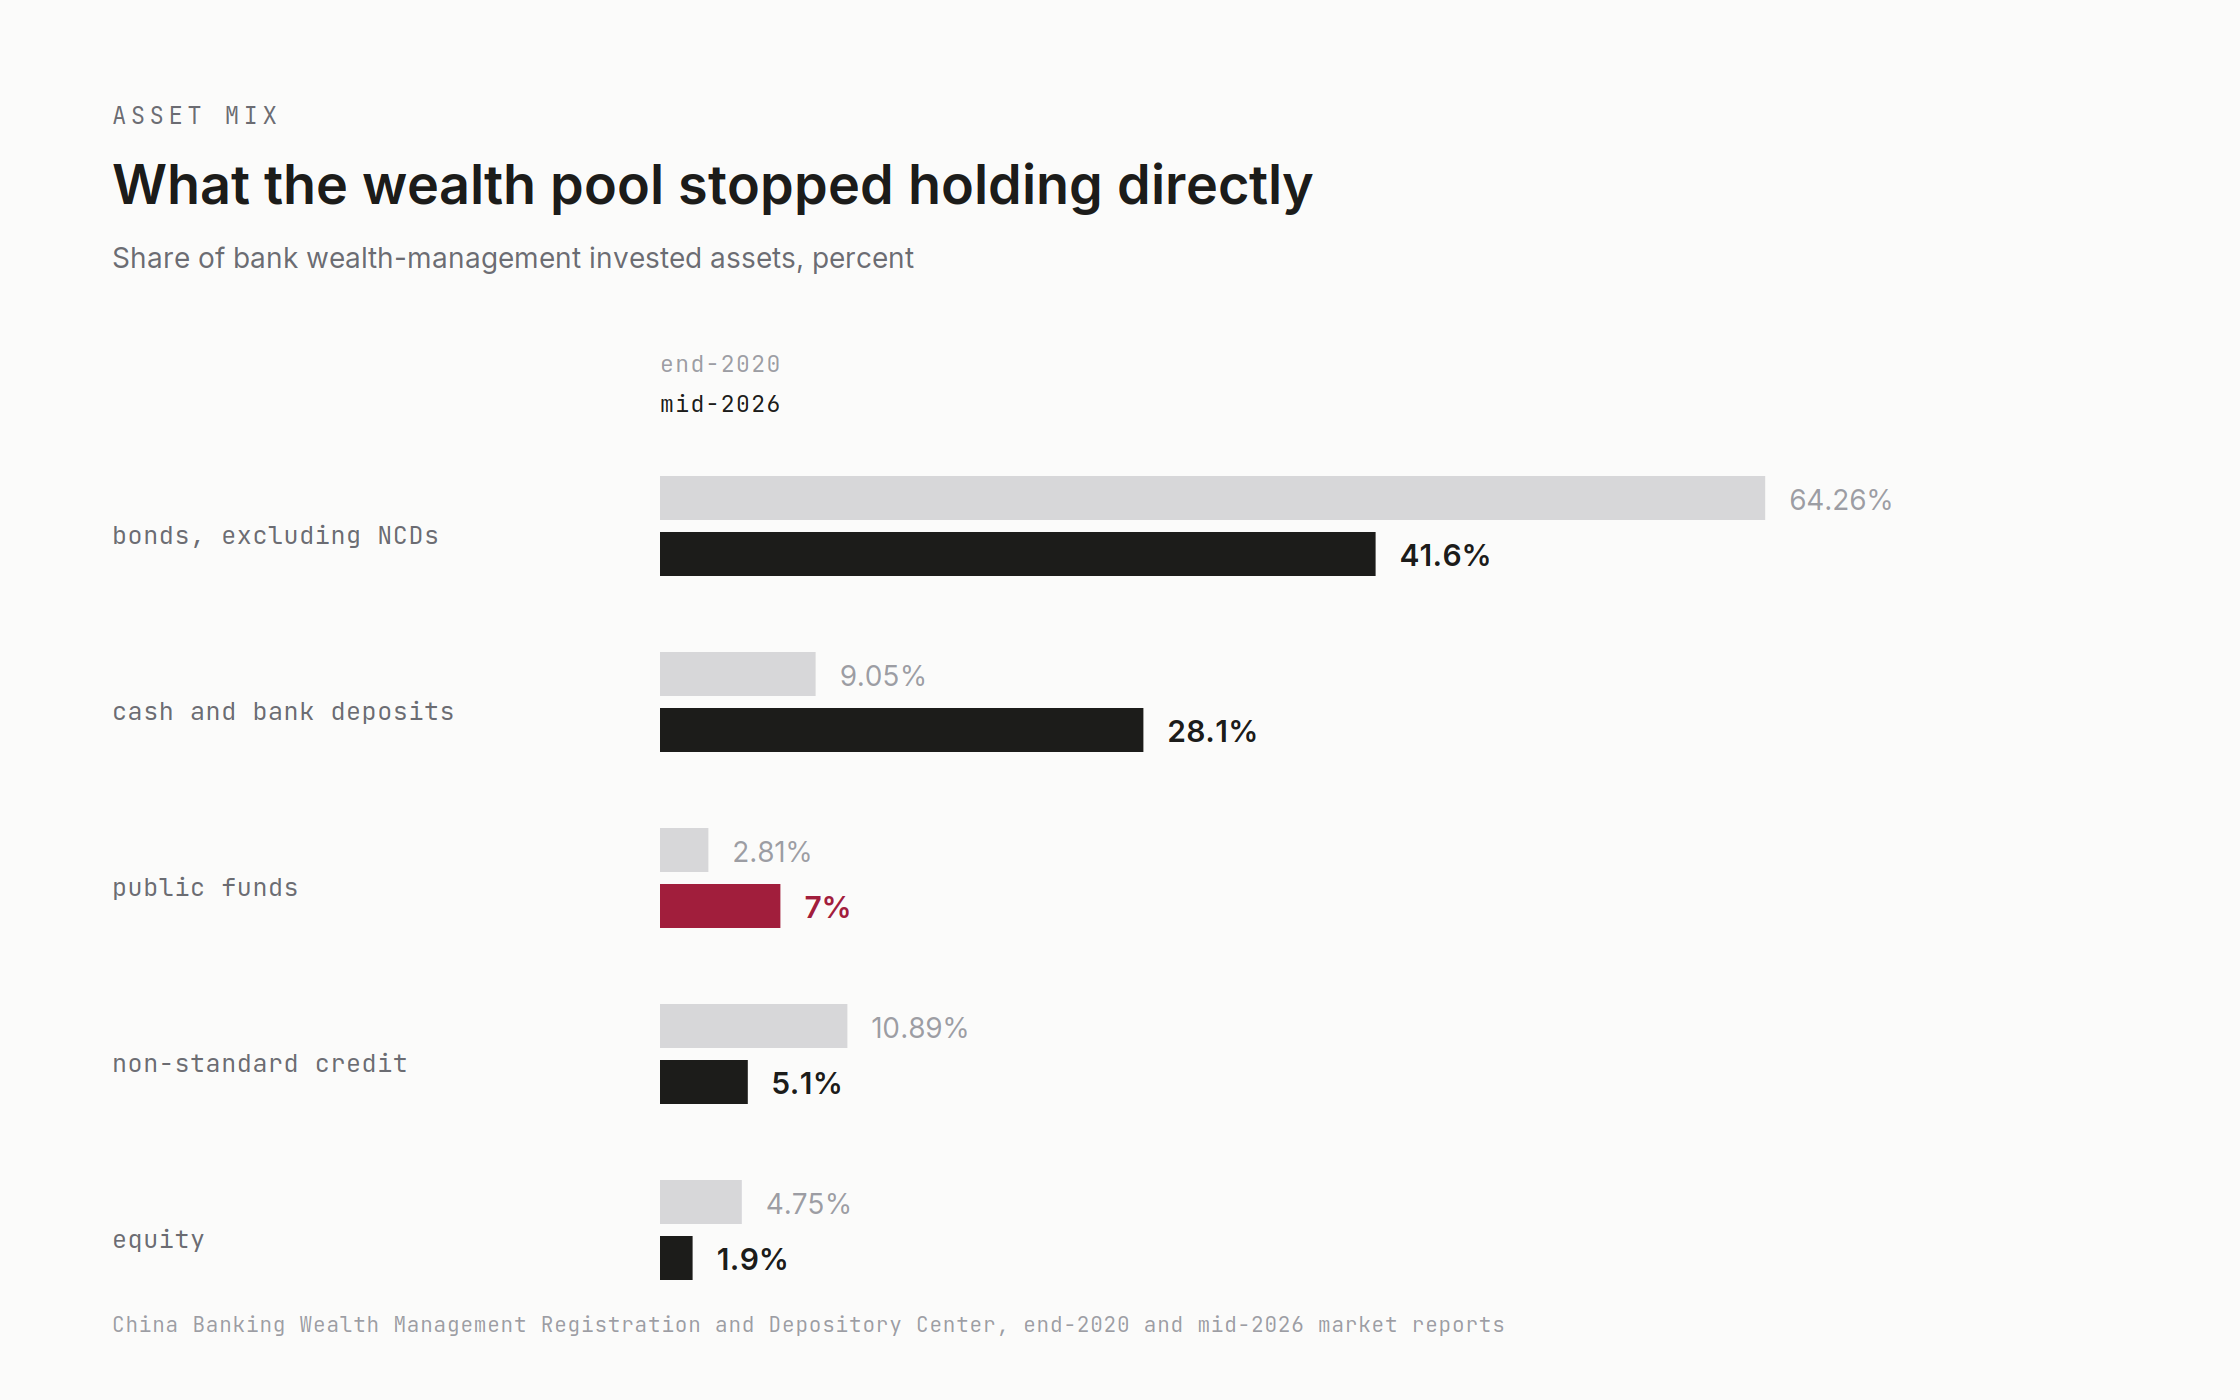
The two developments meet in the wealth managers' own books. Public funds reached RMB 2.52 trillion of their invested assets at mid-year, 7% of the total and the highest share recorded, which makes funds the fourth-largest asset class in the pool behind bonds, cash and deposits, and certificates of deposit. The position rose from RMB 1.95 trillion in a single quarter. Direct bond holdings including certificates fell to 50.17% of invested assets, the lowest since the 2018 rules. Most of what the managers bought was bond funds. Within the smaller equity sleeve, exchange-traded funds and their feeders account for more than four fifths.
Trusts become service businesses
The 2023 reclassification separated asset management, asset service and charitable trusts, and the growth since has come from the service side. Asset management trusts stood at about RMB 24.43 trillion at mid-2025 on the association's funded-trust measure, three quarters of trust assets, while wealth management service trusts reached RMB 4.37 trillion. Securities investment trusts passed half of funded trusts for the first time in the same period. The revenue consequence is the part that matters. Project financing produced one-off fees. Fiduciary services produce recurring ones, usually smaller per mandate and longer in duration, and they require operations and systems rather than origination.
What scale still buys
Scale still matters, though what it pays for has changed. Research platforms, trading systems, compliance and technology are fixed costs that a larger asset base spreads more thinly, which is why index products with low headline fees are the most scale-dependent of all. The reshuffling in exchange-traded funds over the first three quarters shows both sides: sixteen managers held more than RMB 100 billion of ETF assets, the two largest held more than RMB 620 billion each, and several established houses lost ground because their broad-based products shrank while sector and thematic ones grew. Firms outside that group compete by narrowing rather than by matching.
What the competition now measures
Assets under management answered the question of who was winning for most of the past decade. It no longer does on its own. A wealth manager is read on net value performance and allocation. A fund house is read on fees, benchmark discipline and whether active strategies earn their charges. A private manager is read on strategy, liquidity and exits. A trust company is read on service capability and the quality of its revenue. Each of those is harder to report than a single total, and each takes longer to establish. The question underneath them is unchanged: who manages the money, at what cost, bearing what risk.