Why Long Treasury Yields Stay High
The Federal Reserve stopped raising rates, yet ten- and thirty-year yields sit near the top of their 2026 range. The short end tracks policy; the long end is pricing what the policy rate does not.
A pause that did not carry
The Federal Reserve held its policy range at 3.50 to 3.75 percent through the middle of 2026, and the minutes of its July meeting recorded three members who favoured a further quarter-point increase. A pause at the short end did not pull the long end down with it. By late August 2026 the ten-year Treasury yield sat near 4.69 percent and the thirty-year above 5.2 percent, close to the upper end of the year's range. The distance between the policy rate and the long bond is the subject here.
How a long yield is built
A long-dated Treasury reflects more than today's policy rate. A workable approximation reads the yield as the expected average path of short-term rates plus a term premium, the extra return investors ask for committing money over many years while inflation, fiscal policy, and future demand stay uncertain. A second reading splits the nominal yield into a real yield, expected inflation, and compensation for risk. Both describe the same price from different angles, and both explain why a steady policy rate can sit beneath a long yield that stays high: the long yield moves with real rates, inflation risk, and the price of duration, none of which a pause resolves.
What the 2026 data show
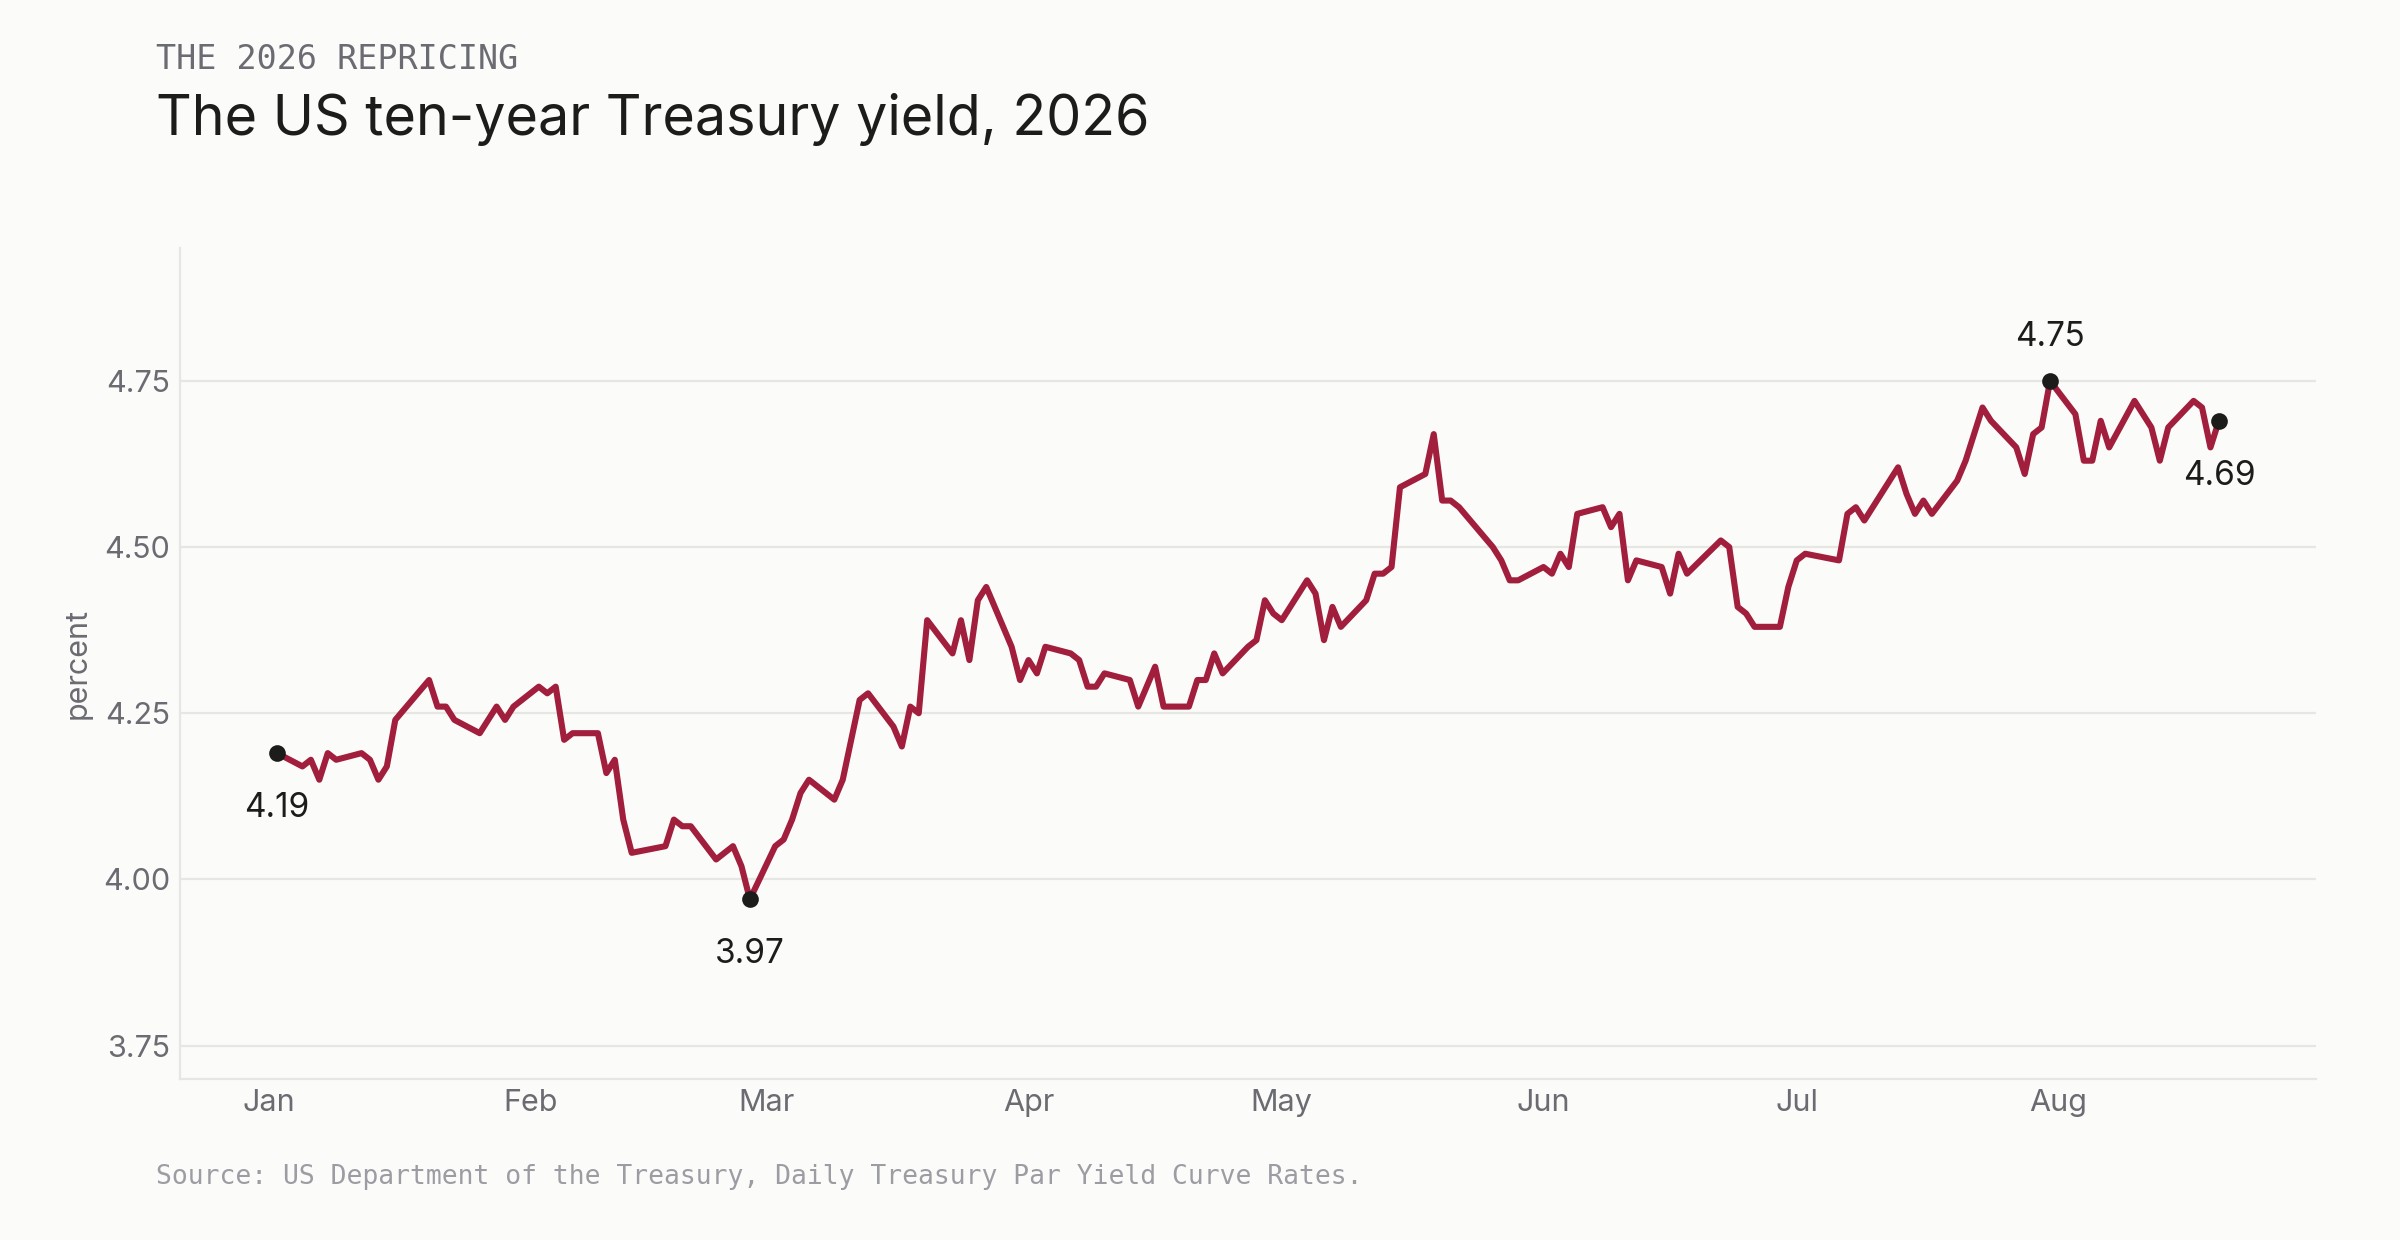
The Treasury's own curve data trace a rising path with real volatility inside it. The ten-year yield began 2026 near 4.19 percent, fell to a low around 3.97 percent late in the winter, then climbed through the spring and summer, reaching a 2026 high near 4.75 percent by the end of July before settling around 4.69 percent, roughly 50 basis points above where it started. The shape of that path matters: the yield did not hold its level on the strength of a single auction or announcement. The market repriced growth, inflation, borrowing, and duration risk repeatedly, and each decline met renewed selling.
Supply at the long end
Monetary policy explains part of the pattern; federal borrowing explains more of the long end. The federal debt passed $40 trillion in 2026, and at that scale the government's gross interest runs on the order of $3 billion a day, rising as older low-coupon securities mature and refinance at current rates. The Treasury estimated it would raise roughly $739 billion in privately held net marketable debt in the July to September quarter and about $628 billion in the quarter that follows. That supply does not translate mechanically into higher yields, though it enlarges the quantity of duration the market has to hold, and a market asked to hold more duration tends to ask a lower price, which is a higher yield.
The curve's message
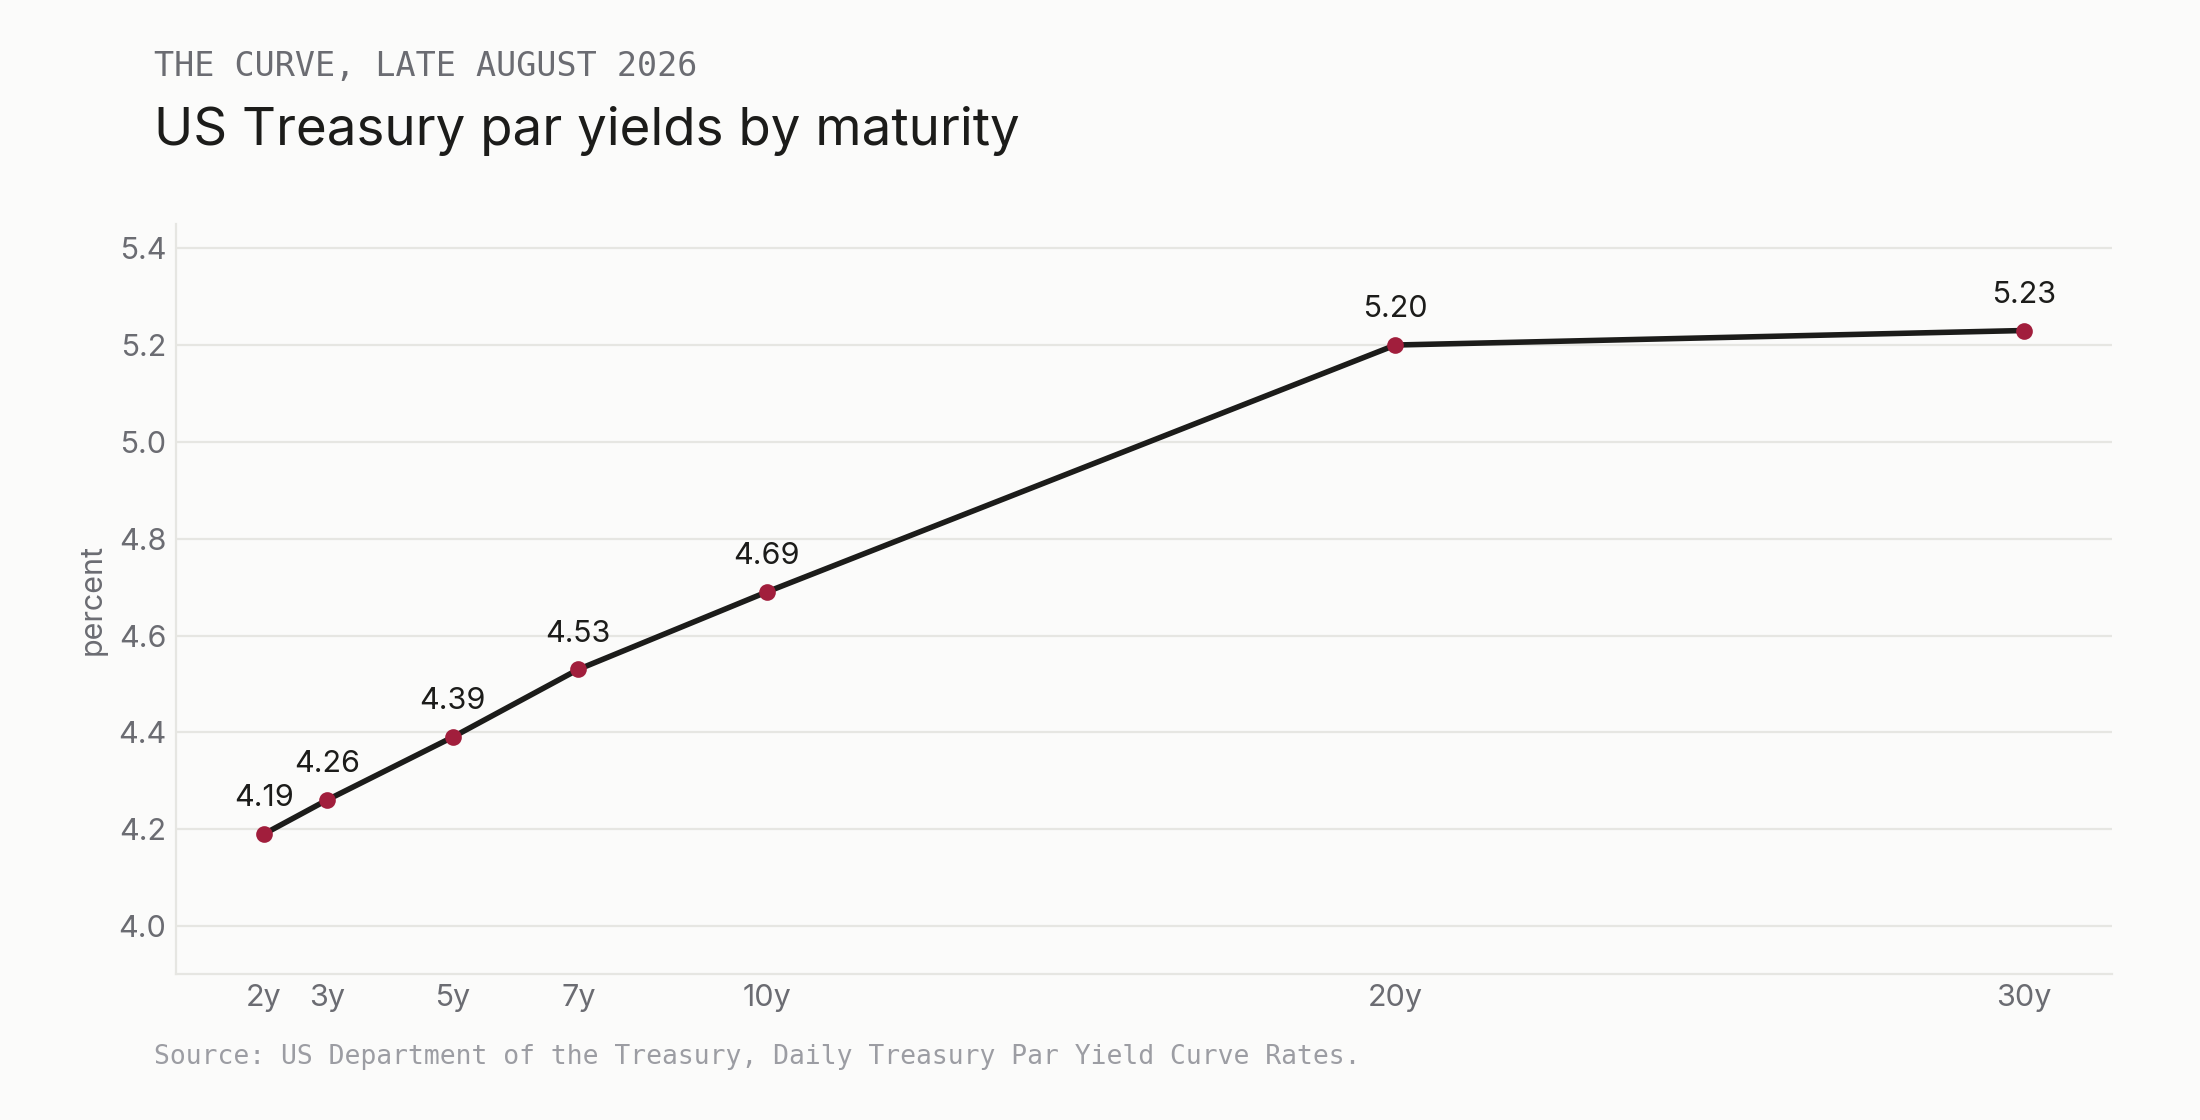
The shape of the curve carries the same signal. By late August 2026 the two-year yield was about 4.19 percent, the ten-year about 4.69, the twenty-year 5.20, and the thirty-year 5.23. The ten-year sat about 50 basis points above the two-year, and the thirty-year about 104 basis points above it. The front of the curve tends to follow expectations for policy; the far end reflects fiscal supply, long-run inflation risk, and the cost of locking up capital for decades. When the long end rises relative to the short end the curve steepens, and a steepening of this kind points to a term premium doing more of the work. A market moved mainly by policy expectations can turn quickly on softer data; a market moved by supply and term premium can stay under pressure while growth slows.
Why buybacks do not settle it
Officials have leaned against the long end through liquidity-support buybacks, raising the size of individual long-dated operations to at least $4 billion, from a $2 billion maximum. Buybacks can improve liquidity by taking in older, less-traded securities, and can signal attention to market functioning. Their scale stays modest against the stock of marketable debt, and they change the composition and liquidity of what is outstanding while the underlying supply is set by spending, revenue, and refinancing. When the larger operations were announced, the thirty-year yield still edged up, from about 5.19 to 5.23 percent. The tool reaches how the market trades and leaves what the market must absorb where it was.
What sets the price of the long end
High long-dated yields, on this reading, come from several forces at once: real rates that have stayed firm, inflation that remains uncertain, a growing stock of debt to finance, and a larger premium for holding duration. A higher coupon can look attractive, yet it does not remove price risk; when yields rise, the price of a long bond can still fall a good deal. The division of labour is the durable point. The central bank sets the overnight rate. The bond market sets the price of uncertainty over the next ten and thirty years, and through 2026 it has been marking that price up.