Treasuries, the Dollar and Risk Appetite: How External Shocks Affect China's Financial Markets
Long US yields stayed high through October while the RMB strengthened against the dollar. The two coexist because China is a set of markets rather than one, and a shock from the same source lands in each with a different weight.
Two facts that look contradictory
In October 2026 long-term US Treasury yields remained high, and over the same period the RMB strengthened against the dollar, with the central parity at 6.7220 in mid-month. Read through the rate gap alone, those two facts sit badly together: tighter dollar conditions are supposed to pull money toward the dollar. The reconciliation is that a currency responds to the dollar's own trend, trade conversion, investment flows, expectations and policy at once, and the rate gap is one input among them. The same ambiguity runs through every Chinese market. Treasury yields, A-shares, Hong Kong equities and Chinese issuers' dollar bonds can all move on the same external news and still move differently.
At the G20 meeting in Bangkok in October, the PBOC governor argued that global imbalances should be analysed through channels such as capital flows rather than the current account alone. The IMF's October stability report made a parallel point from the other direction, flagging a sharp rise in sovereign yields as a potential trigger for stress, and noting that heavier bond financing by hyperscalers now ties AI investment more closely to credit markets. Both remarks describe the same thing: the transmission runs through financial links, and those links are specific.
What actually arrives
US conditions decompose into five variables that need not move together. The policy rate sets short-term funding costs. Long Treasury yields carry expected future rates plus a term premium. Credit spreads price default risk. Equity valuations reflect earnings, discount rates and risk appetite. The dollar shapes where cross-border money goes and what foreign-currency balance sheets are worth.
A rise in the ten-year yield can come from at least three sources, and the source changes what it means abroad. Stronger-than-expected growth lifts earnings forecasts too, so shares may hold. Higher inflation expectations imply policy stays tight for longer. Deficits, bond supply and a widening term premium are a third case, where investors simply ask more to hold duration. An IMF fiscal note from October observed that higher borrowing costs add to fiscal strain where debt is already high, and that rising yields and fiscal strain can feed each other. Separating rate expectations from the term premium is what identifies the shock.
Five channels
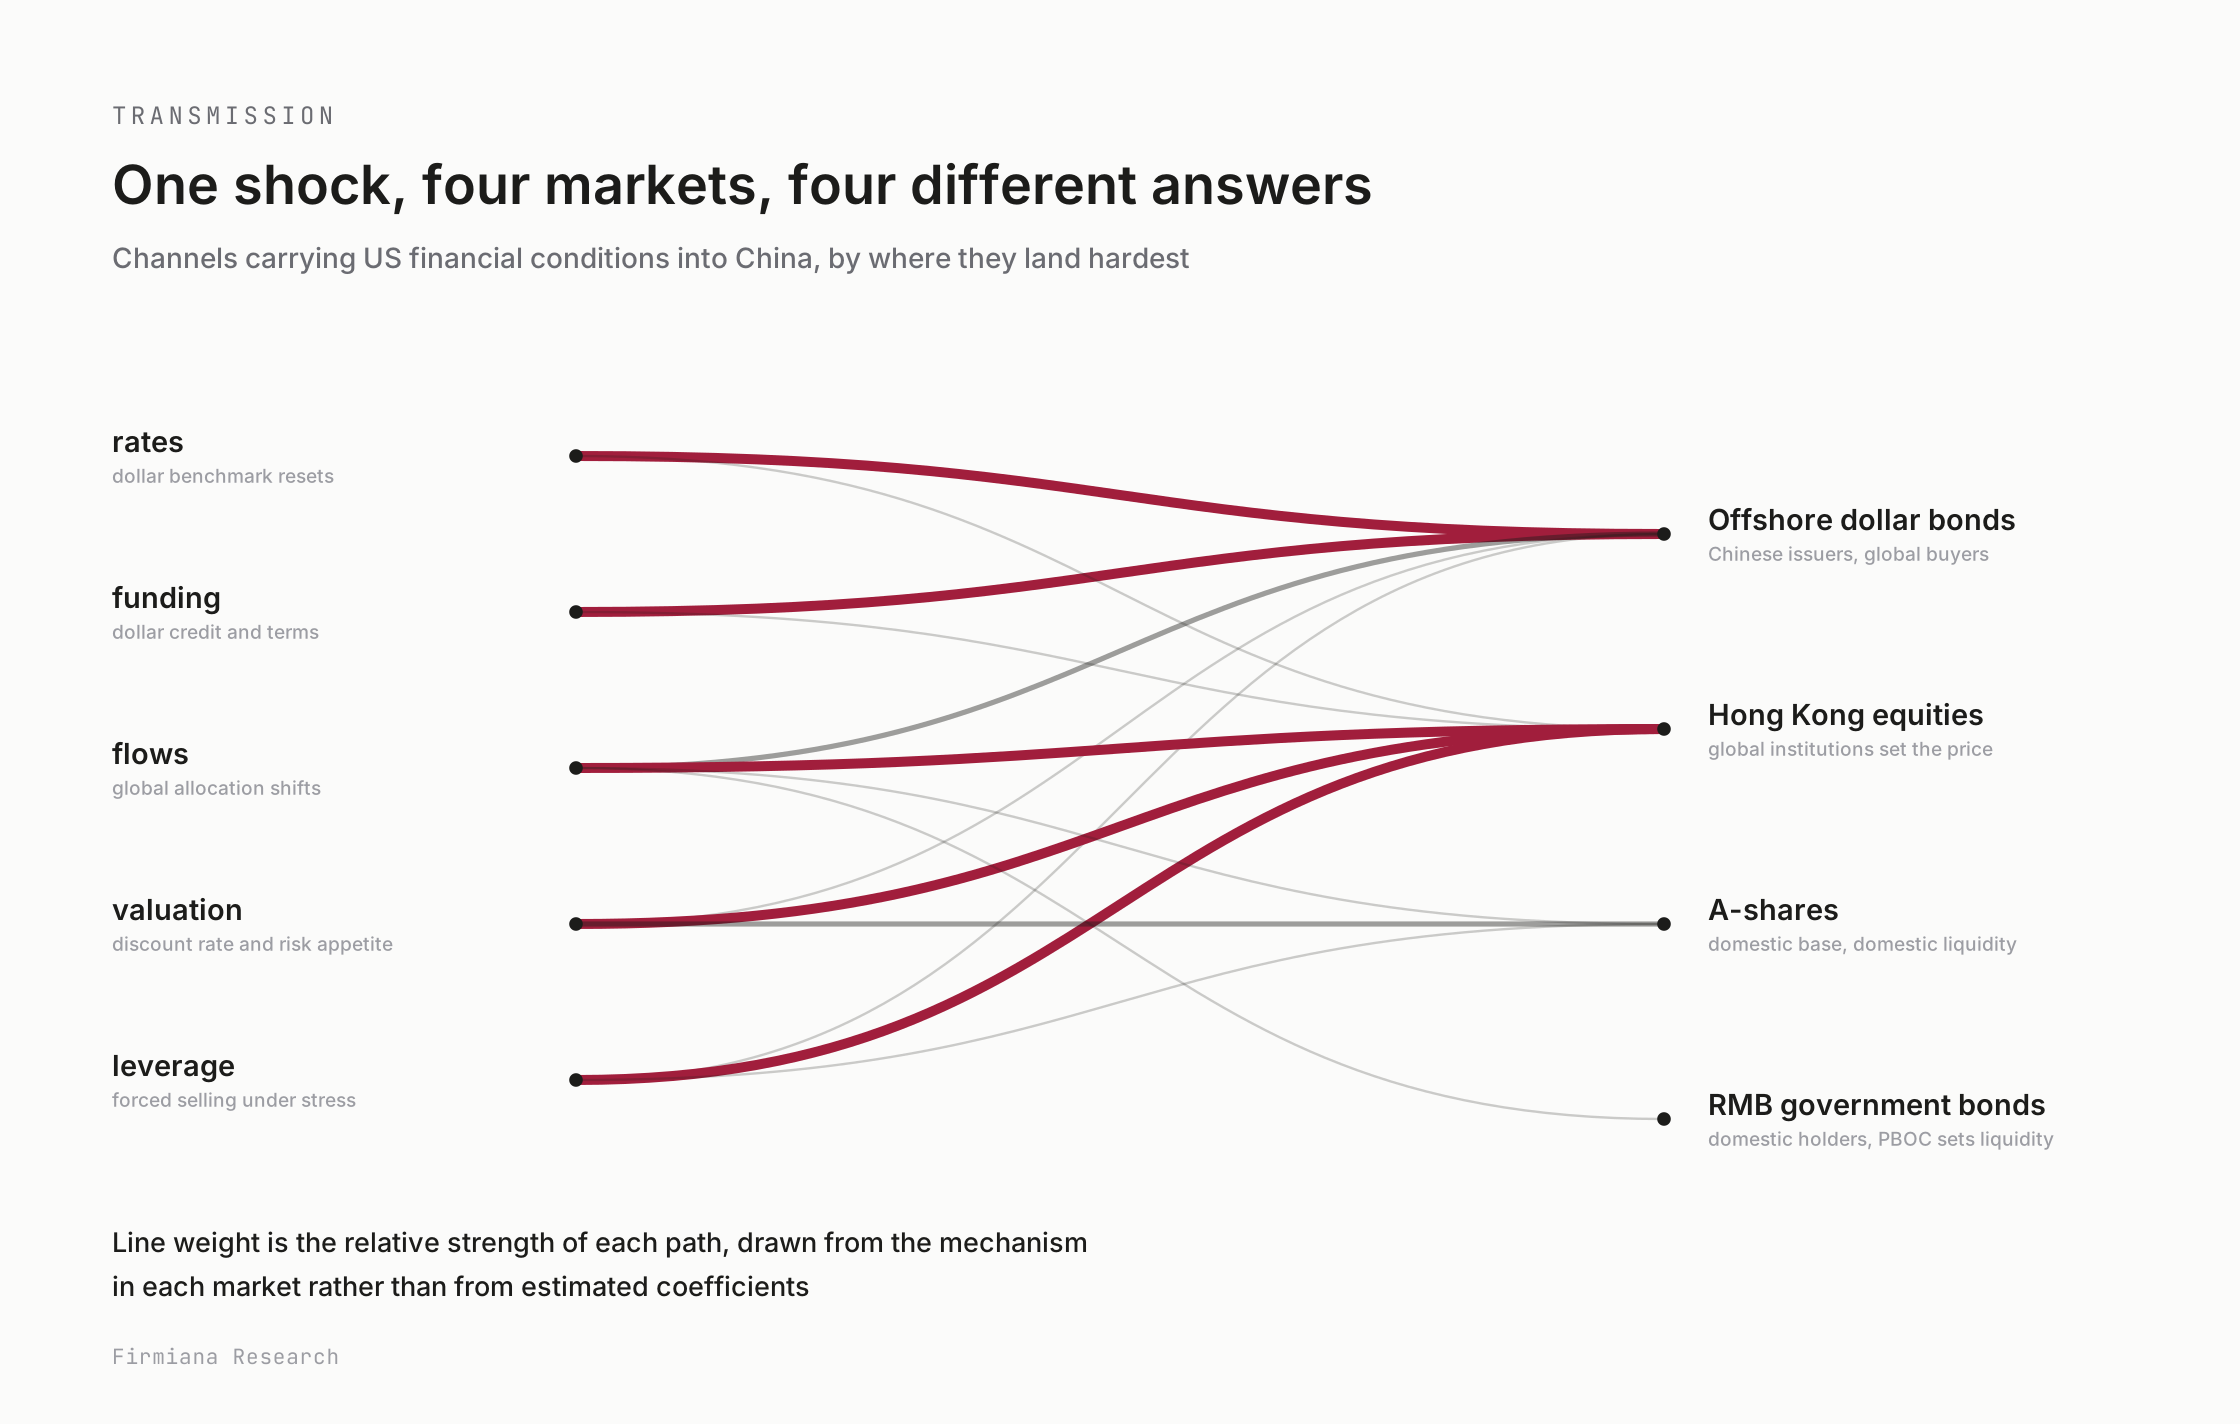
US conditions reach China through four main channels plus a fifth that works through liquidity. Rates come first, because the dollar curve is the pricing reference for dollar bonds, loans and derivatives. Capital flows come second, as global investors adjust allocations. Asset valuation is third, as stocks and bonds reprice risk. Dollar funding and credit conditions are fourth, reaching firms that borrow offshore. The fifth is leverage and liquidity: when volatility jumps, leveraged investors meet margin calls by selling what is liquid, which is often what has been holding up.
Each channel reaches a different part of China's financial system, and each part has a different investor base. That is why the four markets answer the same shock differently, and why the strength of a path has to be argued from the mechanism rather than read off a correlation.
One shock, three prices
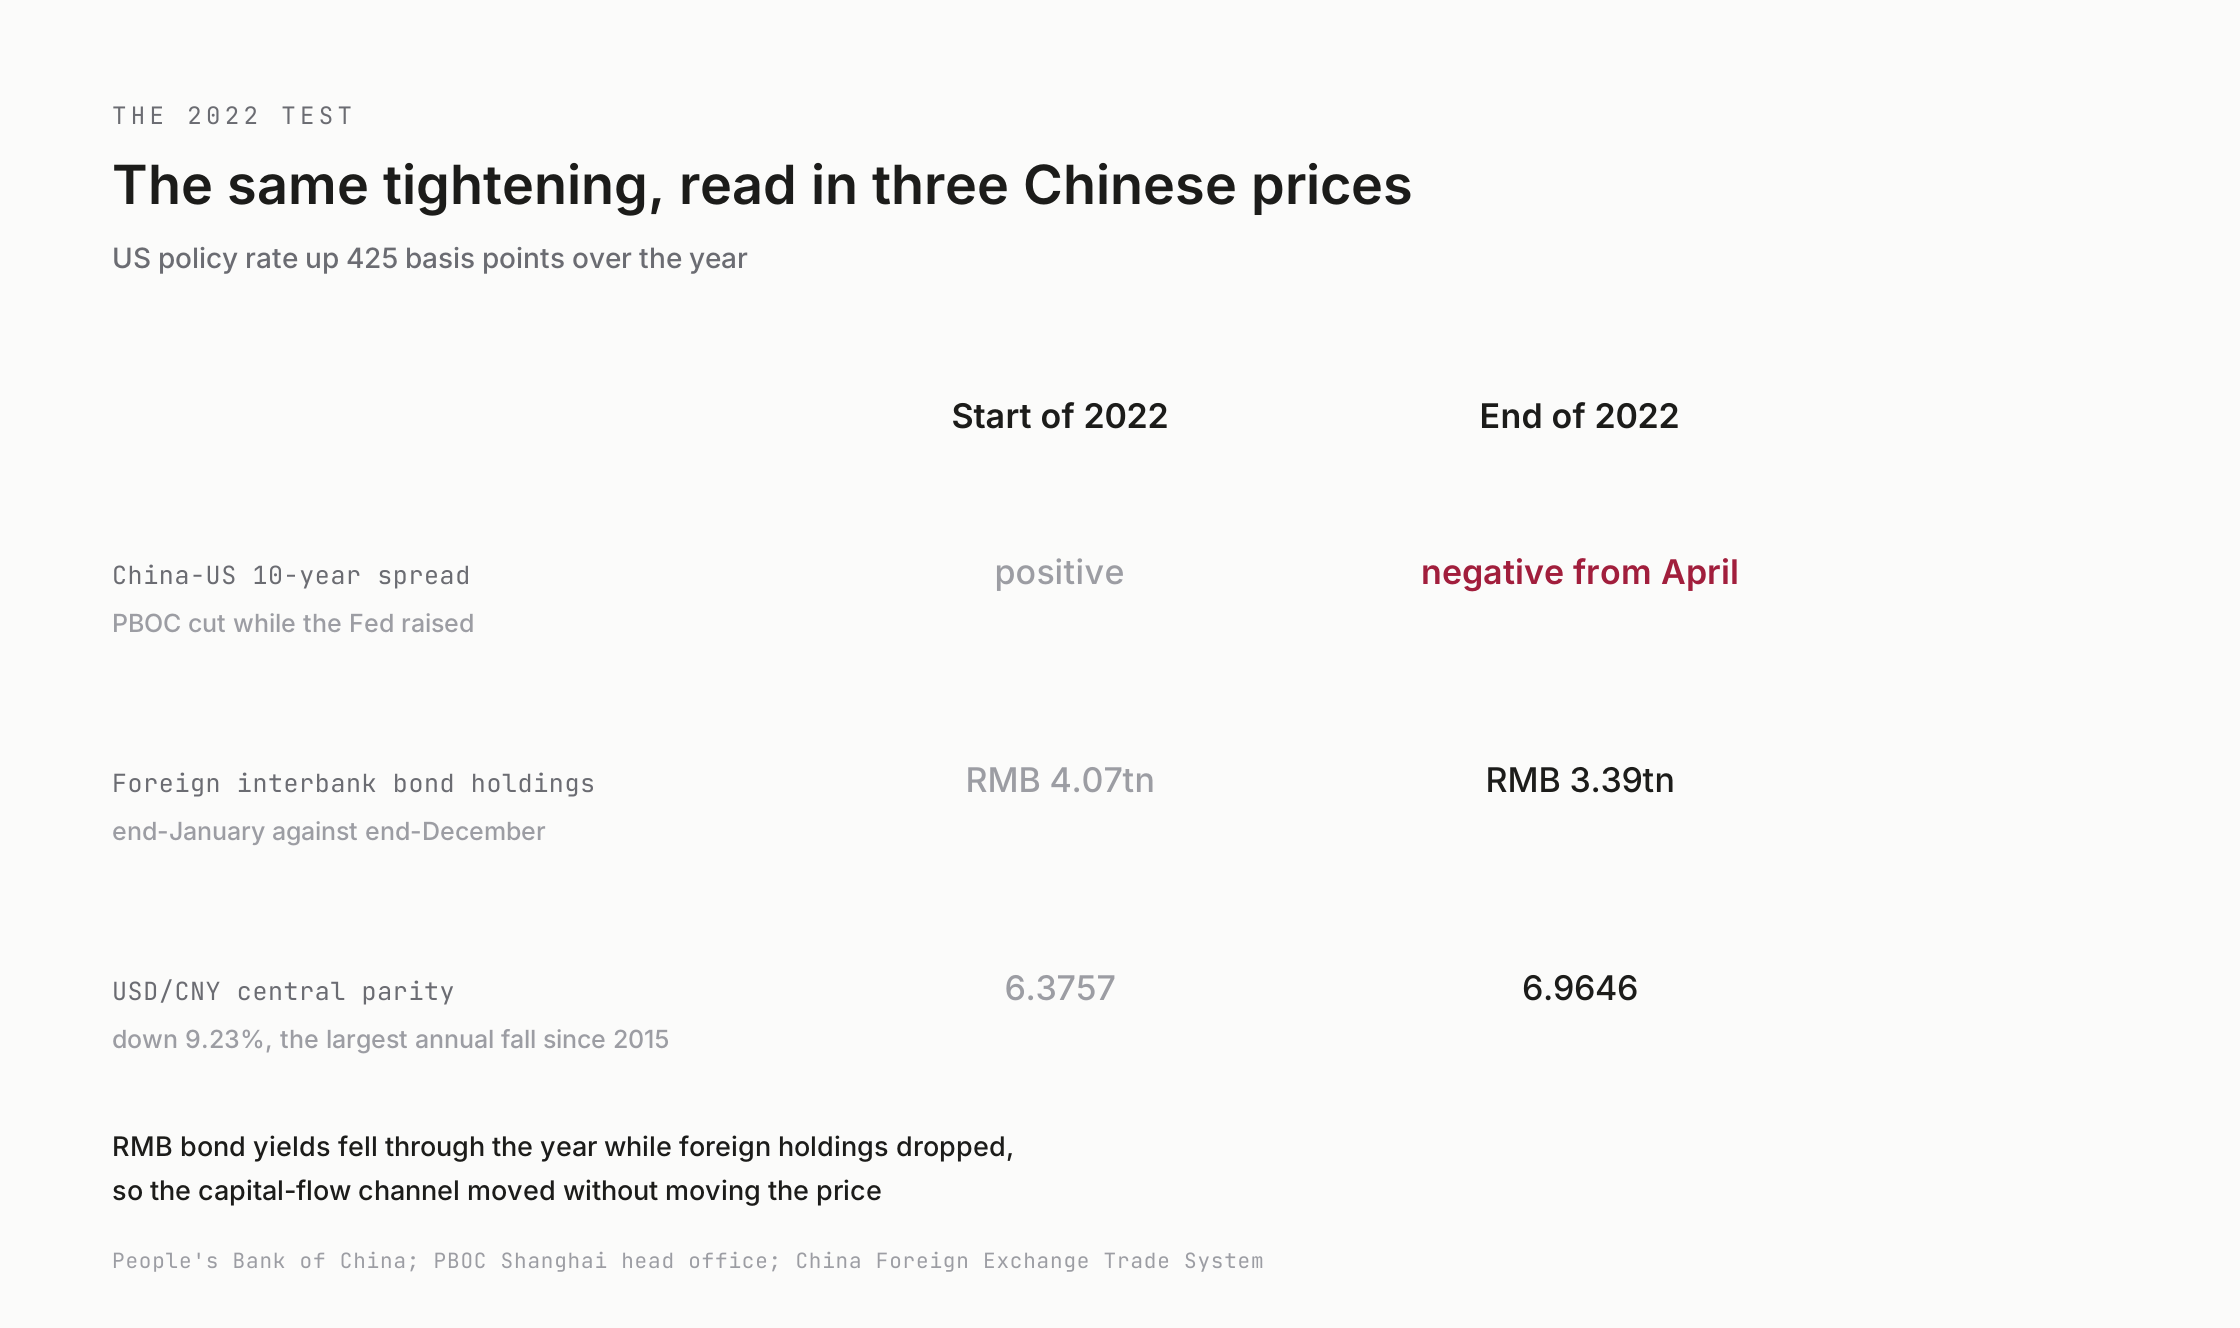
The 2022 tightening cycle is the cleanest available test. From March the Fed raised seven times, taking the target range to 4.25% to 4.5% by December, a rise of 425 basis points. China moved the other way: the PBOC cut the medium-term lending facility rate by 10 basis points in January to 2.85%, and again in August to 2.75%.
Three Chinese prices responded, and they did not agree. In April the China-US ten-year spread turned negative for the first time in over a decade, because RMB yields followed domestic conditions while Treasury yields rose. Foreign institutions cut interbank bond holdings from about RMB 4.07 trillion at end-January to RMB 3.39 trillion by year-end. The central parity fell from 6.3757 to 6.9646, a drop of over 9.23% and the largest annual fall since the 2015 reform. The capital-flow channel moved visibly while the price it was supposed to move stayed put, because domestic institutions remained the main holders.
Where it lands hardest
The channel with the least friction is the one that runs through dollar funding. A Chinese firm planning a ten-year dollar bond prices it as the matching Treasury yield plus its own credit spread. If the benchmark moves from 4% to 5% and the spread holds at 1.5%, the indicated yield goes from 5.5% to 6.5%. On a US$500 million issue, that is roughly US$5 million a year in additional interest before fees, issue discount and hedging costs.
Nothing about the business has changed. If the higher funding cost raises the weighted average cost of capital, the discount rate applied to overseas projects rises with it, and projects that cleared on net present value may no longer clear. Two cost layers can also rise together, since a fall in global risk appetite widens the firm's own spread at the same time as the benchmark. Terms tighten alongside price: shorter maturities, more collateral, smaller deals. This transmission works through balance sheets and may not appear in any equity index for several quarters.
Where it barely lands
RMB government bonds sit at the other end. They are denominated in RMB, held mainly by domestic banks, insurers and funds whose demand comes from their own asset-liability management, and priced against liquidity the PBOC sets according to domestic growth, prices and financial stability. In 2022 foreign selling and a negative spread coincided, and yields still stayed low.
Equities fall between the two, and the gap between Hong Kong and the mainland is a gap in who sets the price. Hong Kong is a venue where global institutions do the pricing, so shifts in discount rates and risk appetite arrive quickly. A-shares have a large domestic base where domestic liquidity and policy expectations weigh more heavily. The arithmetic of a discount rate explains why the valuation channel bites: a firm with free cash flow of 100 growing at 3% is worth 2,000 at an 8% discount rate and about 1,667 at 9%, a fall of roughly 17% with cash flow unchanged. Growth companies, whose value sits in distant cash flows, are the most exposed to that single point.
Comparisons that mislead
Two indices falling together is not evidence that one caused the other. The Nasdaq 100, Hang Seng Tech and CSI 300 differ in technology weight, earnings sources and investor base, so comparing headline moves can mistake sector mix for transmission strength. Index moves need breaking down by sector before the market-wide response is visible.
Timing needs care too. Asian markets have already opened a new day by the time US markets close, so one, three and five-day windows around major US events give different answers. The IMF's April 2026 report adds a further distinction: emerging market portfolio flows are largely intermediated by nonbanks, and hedge funds, investment funds and particularly passive vehicles react more strongly to swings in global risk sentiment. Which institutions hold the cross-border money sets how fast a shock travels, independently of how large it is.
The policy layer
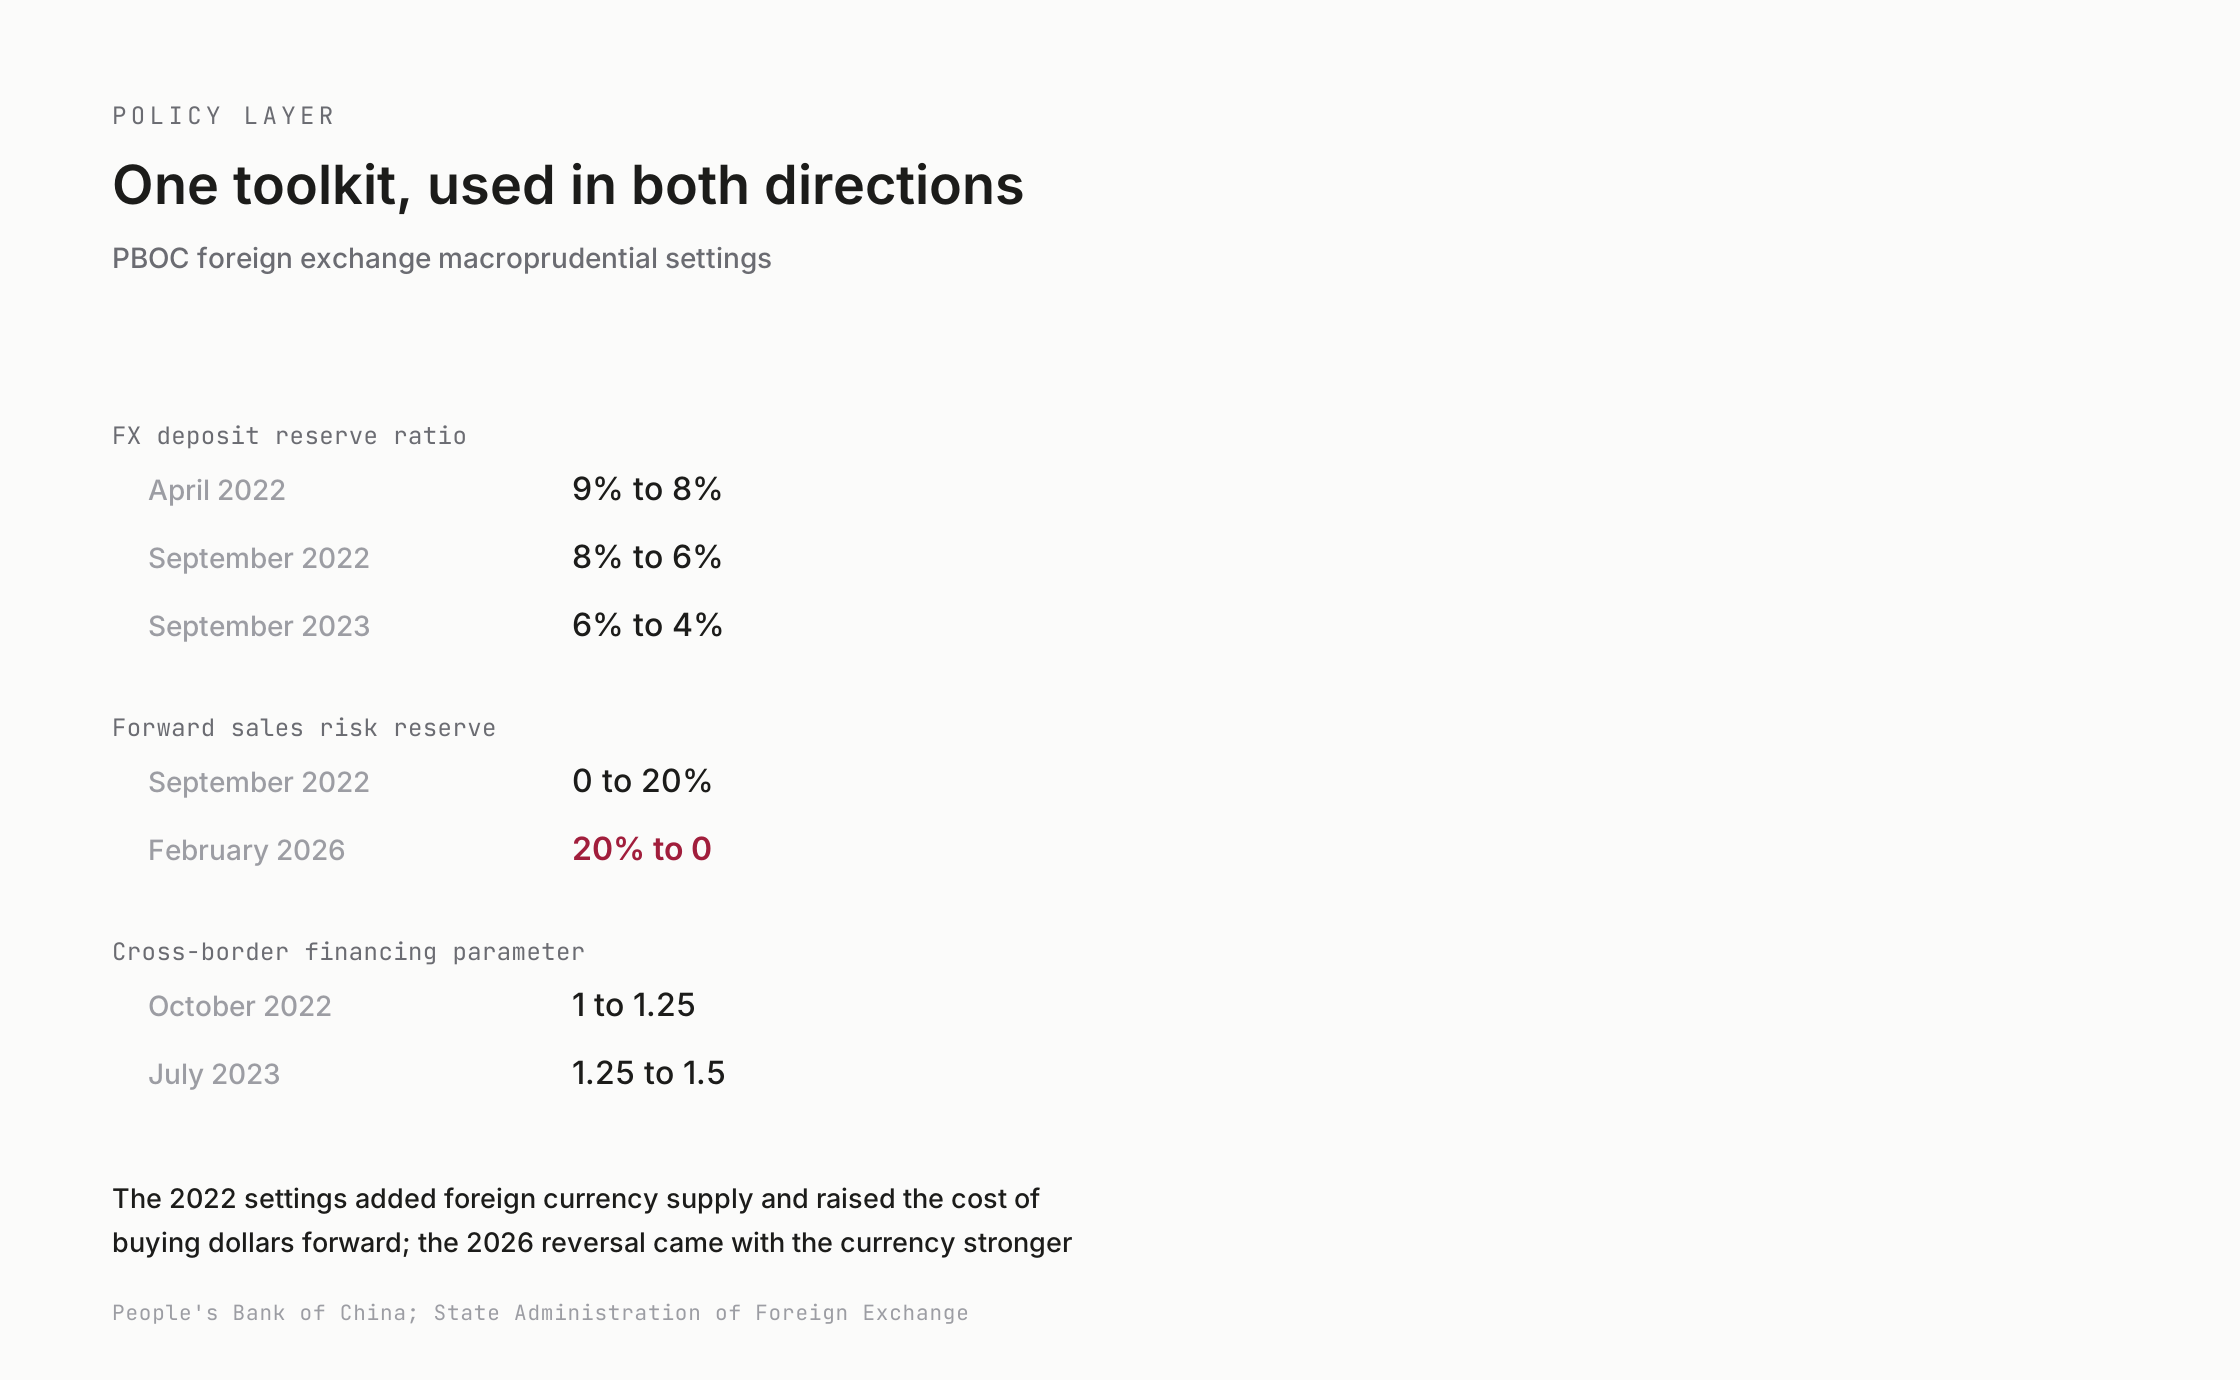
Where a shock reaches the exchange rate, the PBOC has macroprudential tools that work on the cost or the quantity of foreign currency. The record since 2022 shows the same instruments moved in both directions. The FX deposit reserve ratio was cut from 9% to 8% in April 2022, to 6% that September, and to 4% in September 2023. The risk reserve on forward FX sales went from 0 to 20% in September 2022, raising the cost banks pass into forward quotes. The cross-border financing parameter rose from 1 to 1.25 in October 2022 and to 1.5 in July 2023, widening the channel for borrowing abroad.
In February 2026 the forward sales reserve went back to 0, effective in March, nearly three and a half years after the increase. The settings that absorbed a strong dollar were unwound once the pressure reversed. Reading this policy means watching which way a tool moves and by how much, then checking forward quotes and settlement data for what followed.
What to test
A framework is only useful if it can be checked. Three claims here carry a clear mechanism and still need measuring against market data. Long Treasury yields should affect Chinese firms' dollar funding costs more visibly than they affect RMB bond yields. Swings in global risk appetite should reach Hong Kong faster than broad A-share indices once sector mix is controlled. A stronger RMB and tight dollar funding should be able to coexist, which means a currency trend on its own says little about whether financial links are deepening.
The series that would settle them are specific: China and US ten-year yields and the spread; the Nasdaq 100, Hang Seng Tech and CSI 300 broken down by sector; the dollar index against USD/CNY and the CFETS RMB index, which separates the dollar's own move from the RMB's; and US credit spreads against Chinese offshore dollar bond yields and issuance volumes. Domestic policy, data and earnings news belong in the same model, with rival explanations handled rather than assumed away.